Instagram profile analytics tools read the public data Instagram already shows on any profile — follower count, post count, engagement on visible posts, posting cadence — and turn it into the metrics that actually matter: engagement rate, real-vs-fake follower split, best-time-to-post heatmap, and content-mix gaps. Nothing about private accounts, nothing about DMs, nothing about saves — just smart math on what’s already public.
⚡ Key takeaways
- Follower count is a sum of four very different things — real, dormant, fake, and private. The real number is what matters.
- Engagement rate is the only metric that actually predicts reach and partnership value.
- Best-time-to-post heatmaps are calculable from the visible post timestamps alone.
- Content mix vs engagement mix almost always shows a gap — the gap is the strategy insight.
- Everything here is public data — no login, no privacy violation, no Instagram terms broken.
What “public profile data” actually includes
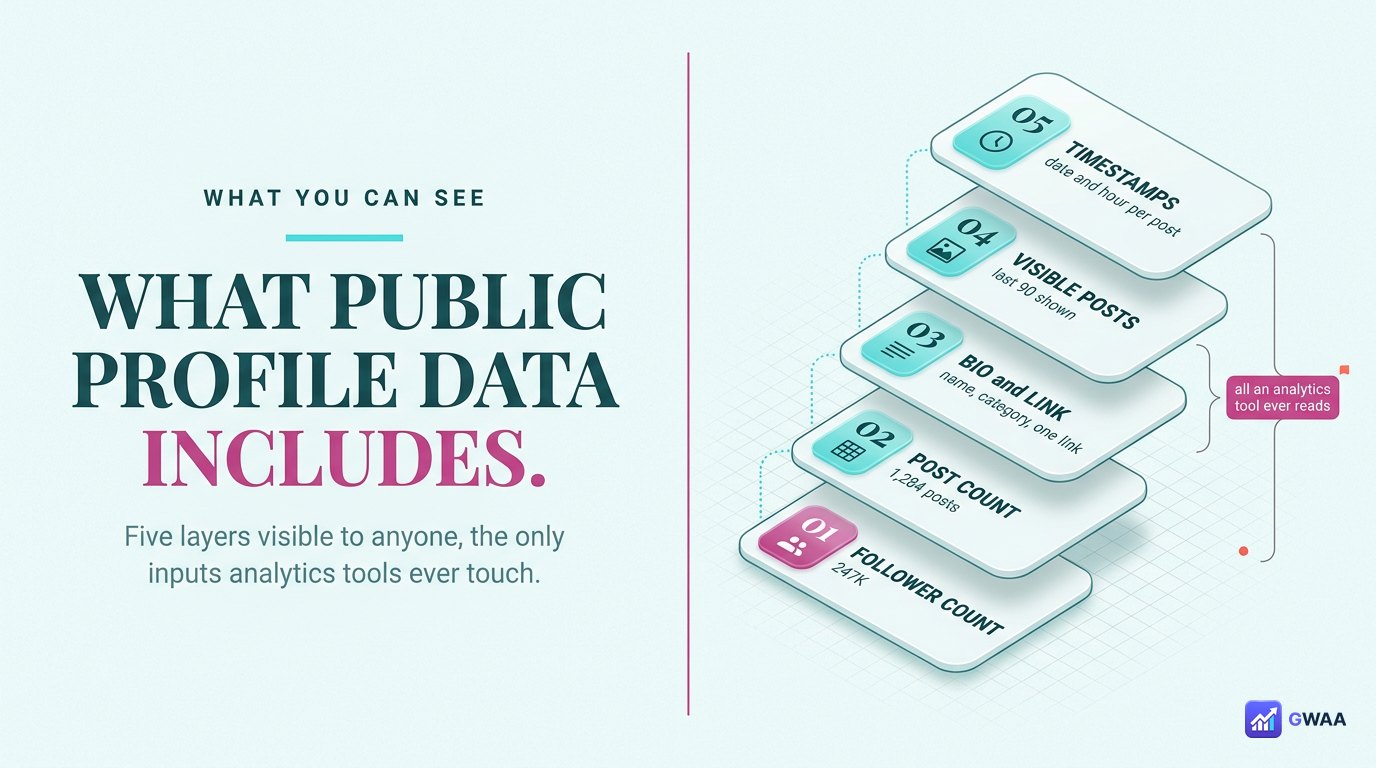
Every public Instagram profile shows the same five layers of data to anyone who visits it. Analytics tools work with these five and nothing else:
- The three stat tiles. Posts count, follower count, following count. These are the headline numbers and the starting point for every other calculation.
- The bio block. Display name, username, bio text, contact info, link in bio. Useful for detecting niche, monetisation status, and CTA strength.
- The post grid. Every visible post, with caption, hashtags, like count, comment count, and post timestamp. The raw material for engagement and cadence math.
- Reels and tagged tabs. Reels with view counts. Tagged posts showing who’s referencing the account.
- Highlights row. Pinned albums labelled by topic — tells you what the account considers its evergreen content.
That’s the entire dataset analytics tools work with. No private DMs, no saved-post lists, no story view-counts (those are owner-only). Just the visible surface, processed intelligently.
The follower count is FOUR different things
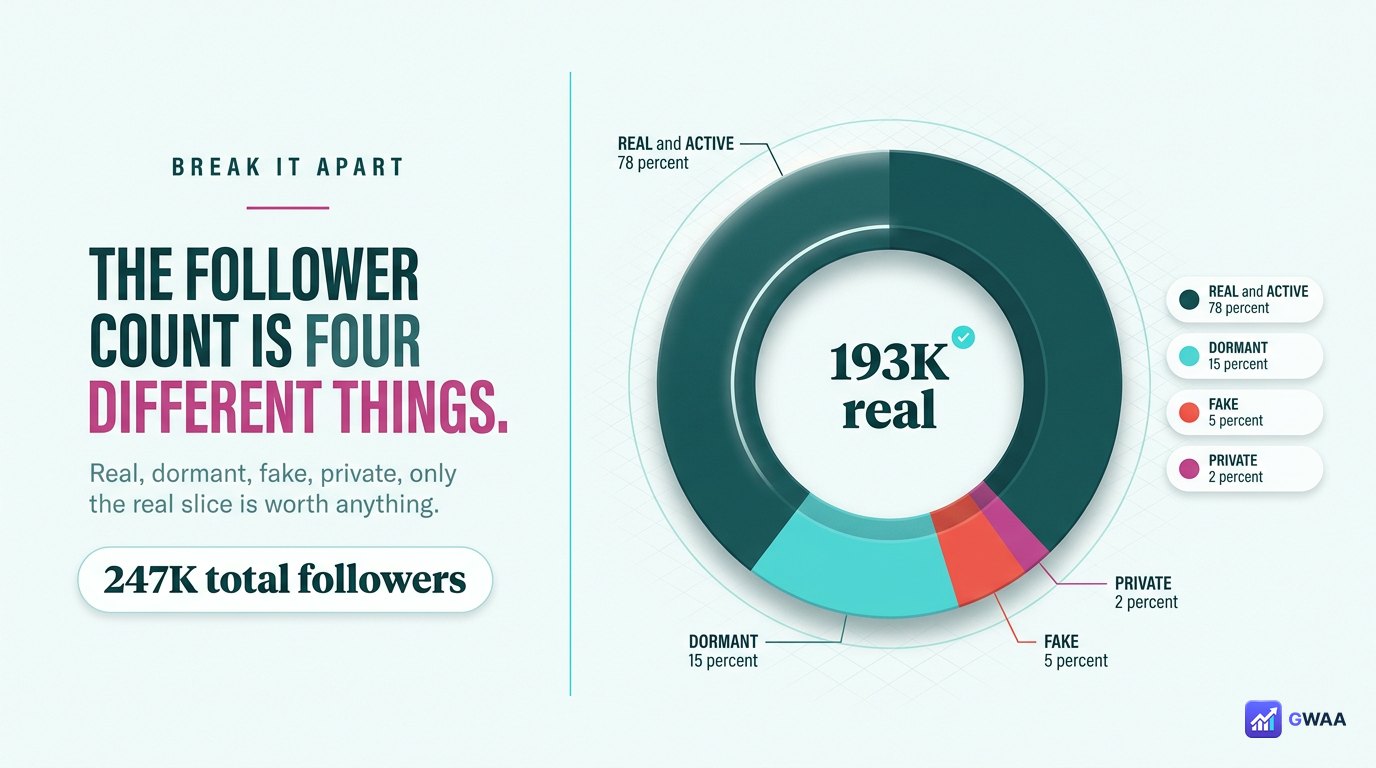
The single follower number you see on a profile lumps together accounts that behave completely differently. Decent analytics tools break it apart:
- Real active accounts (typically 60-80%). Real people who log in regularly, post sometimes, comment occasionally. These are the followers who actually see and engage with new posts.
- Inactive or dormant (typically 10-20%). Real people who created an account years ago and stopped using it. The follow is permanent until they delete, but they don’t see new content because they don’t open the app.
- Bots / fake / mass-follower accounts (typically 2-15%). Automated accounts that follow thousands of profiles to look real for spam purposes. Some are obvious; some are sophisticated.
- Private accounts (typically 1-3%). Real users with private profiles. Counted as followers but their behaviour can’t be analysed.
A 250K account where 80% are real has 200K real reach. A 250K account where only 40% are real has 100K real reach — same headline number, half the actual value.
Engagement rate — the only metric that matters
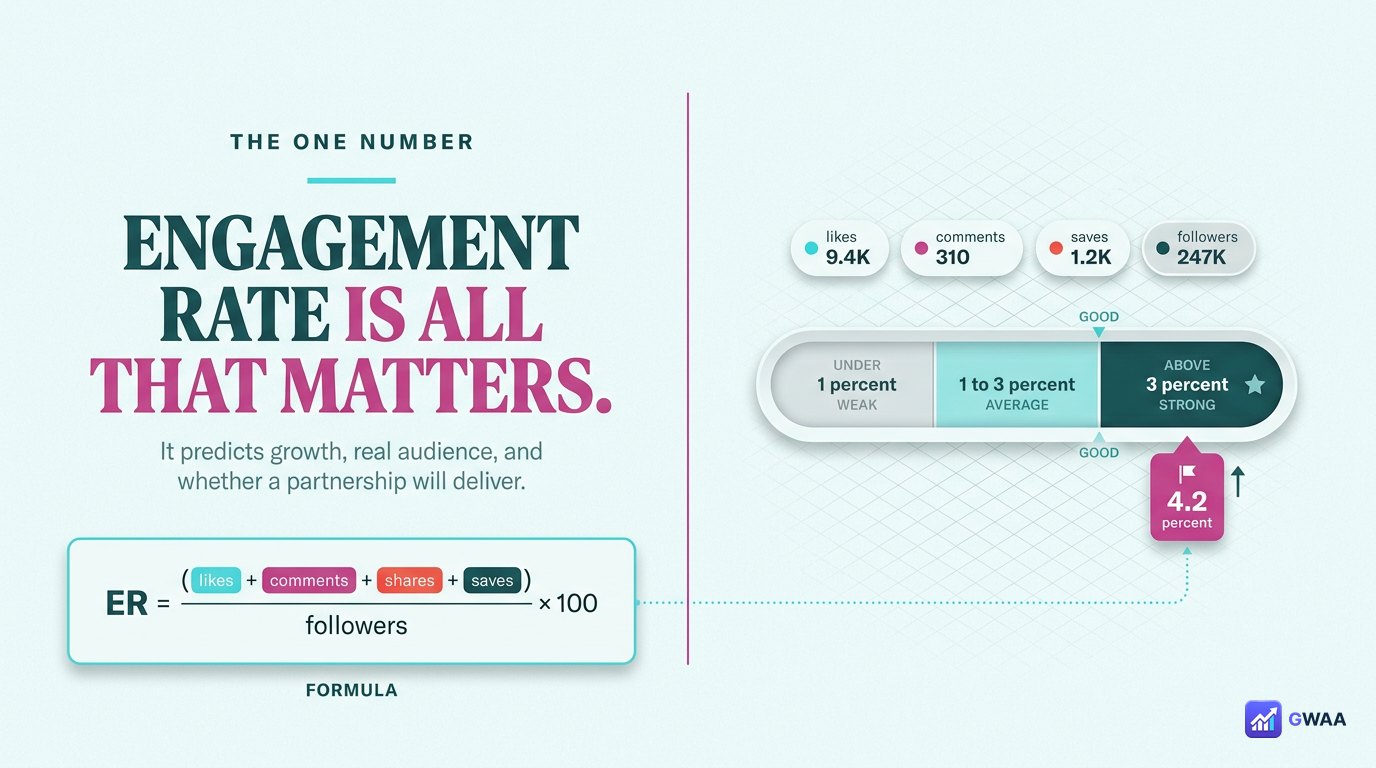
If you can only look at one number, look at engagement rate. It’s the single metric that predicts whether a profile is actually growing, whether a partnership will deliver, and whether the followers are real.
The formula is simple: total engagement on recent posts divided by follower count, multiplied by 100. Engagement on a post = likes plus comments plus shares plus saves. Average it over the last 10-20 posts so a single viral hit doesn’t skew the picture.
The benchmarks have stayed roughly consistent for the past three years:
- Above 3% = strong. Active, engaged audience. Good growth potential, good partnership value.
- 1-3% = average. Healthy but not exceptional. Most accounts in this range.
- Under 1% = weak. Either fake followers, declining audience, or content that doesn’t resonate. Investigate before partnering.
- Tiny accounts can show 10%+. Normal for sub-10K accounts where every follower is a personal connection.
Engagement rate cuts through the vanity-metric fog faster than any other calculation.
Best-time-to-post — calculable from public data
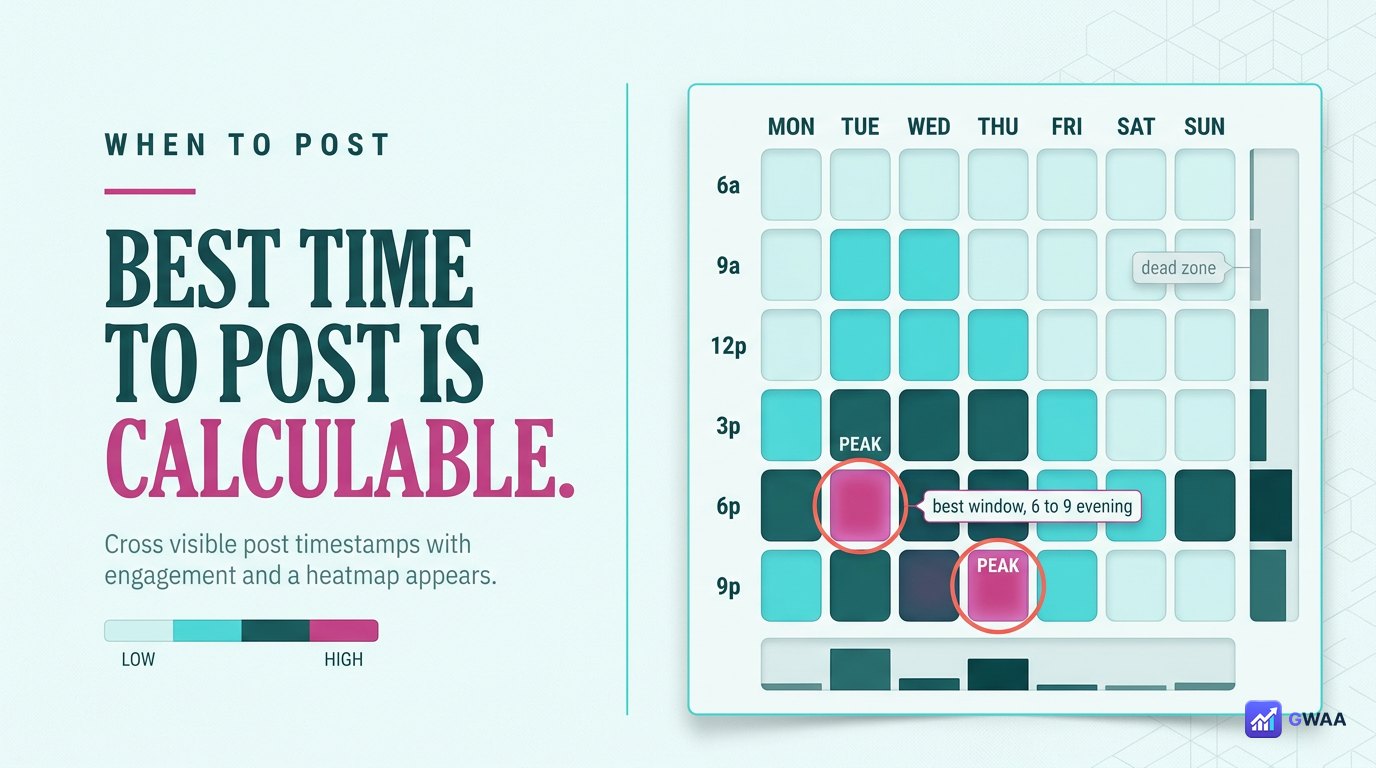
Every visible post has a timestamp. Cross-reference timestamps with engagement levels and a heatmap emerges showing which days and hours produce the most reach for this specific account.
The heatmap isn’t the same as generic “best time to post” advice. It’s specific to this account’s audience. A fashion brand’s audience might peak at 7pm on Mondays. A B2B account’s audience might peak at 9am on Tuesdays. The data answers the question for the specific profile, not a generic platform average.
Use this when planning your own content: post when their audience is online if you’re targeting a similar demographic. Use it for partnership timing: schedule sponsored posts in the partner’s peak window for maximum reach.
Posting cadence drives reach more than any single post

Instagram’s algorithm rewards consistency. Accounts posting 5+ times per week consistently outperform accounts posting once per week, even when the once-per-week posts are individually better.
The cadence signal tells you several things at once:
- How seriously the account treats Instagram. Daily posters are running a real channel; weekly posters are using it as a side project.
- How reliable the audience reach is. Frequent posters maintain top-of-mind awareness; infrequent posters fade from algorithmic relevance between posts.
- What growth trajectory to expect. A frequent poster gaining followers is genuinely scaling; an infrequent poster gaining followers is probably running ads or had a viral moment.
If you’re analysing a profile for partnership: their posting cadence is your reach forecast.
Content mix vs engagement mix — the strategy gap

Compare two donut charts: what an account posts (by format) versus what gets engagement (by format). They’re almost never identical.
The typical pattern in 2026:
- Reels make up 40-50% of posts but 60-70% of engagement. The algorithm strongly rewards video. Accounts that haven’t pivoted to Reels-heavy are leaving reach on the table.
- Carousels punch above their weight on saves. Carousels get fewer total interactions than Reels but a much higher share of saves — the strongest signal of long-term value.
- Single-image posts under-perform. Once dominant, now the weakest format unless the image is exceptional.
- Pinned stories drive minimal new reach but build evergreen profile value.
The gap between what an account posts and what works for them is the highest-leverage insight you can extract from public data. Tell them “Reels are 70% of your engagement — double your Reels output” and you’ve given them genuinely actionable advice.
Follower growth curves reveal what works — and when

Plot follower count over time and the line is rarely smooth. It has bumps, plateaus, and inflection points. Each one corresponds to a specific moment that mattered:
- Steep upward inflection. Usually a viral post or a brand collab that exposed the account to a new audience. Find the date, find the content, learn the formula.
- Long plateau. Content is maintaining the existing audience but not attracting new ones. Time to experiment with new formats or topics.
- Slow downward drift. Followers are unfollowing faster than new ones arrive. Either the niche is shrinking or the content has stopped resonating.
- Sudden vertical drop. Either a bot purge from Instagram or a controversial post that triggered mass unfollows.
For your own account, this is a quarterly retro tool. For competitor analysis, it’s a content-strategy decoder.
Five flags that suggest fake followers

Before partnering with any influencer or competitor benchmark, run these five checks. Any two together is enough to flag the account for closer inspection:
- High follower count, low engagement. 500K followers with 1,200 likes per post is mathematically suspicious. Real 500K accounts get 15,000+ likes per post on average.
- Sudden follower spikes with no viral post. A real growth spike has a viral post anchoring it. A spike with no visible cause usually means a follower-purchase batch.
- Comments are mostly emojis and one-word. Bot networks comment with single emojis and generic words (“Nice!”, “Wow”, “❤️”) because that’s what their training data optimises for.
- Follower geography mismatches content language. An English-language fashion account with 80% Indonesian followers is a strong fake-follower signal.
- Many followers with no profile picture. Click on the follower list. If half the avatars are default grey silhouettes, the followers are bots.
Five analytics tools worth knowing in 2026

The landscape:
- GWAA Profile Analytics — free, no login, public data only. Our recommendation.
- Phlanx Engagement Calculator — the simplest single-metric quick check for engagement rate. Fast.
- Social Blade — long-running historical data on follower growth over years. Useful for longitudinal analysis.
- HypeAuditor — pro-tier audience quality scoring. Paid but thorough.
- Modash — influencer-marketing specific depth, used by brands running large campaigns.
For most one-off lookups, the free tools (Phlanx, Social Blade, GWAA) cover 95% of what you need.
Analytics respects privacy — public profiles only

Every legitimate profile analytics tool reads only public data. Private accounts are excluded entirely — not because the tools choose to respect privacy, but because Instagram refuses to serve private data to any external request.
This makes analytics tools fundamentally safe to use both ethically and legally. You’re not bypassing anything; you’re looking at the same public profile that Google indexes, that link previews fetch, that anyone visiting the URL can see. The tool just does the math on it for you.
Analysing your own account vs others
If you have a Creator or Business account on Instagram, Meta gives you its own analytics suite (Insights) covering data only available to the account owner: story views, profile visits, reach, demographics. That data is richer than what external tools can see, because Meta knows your DM activity, your saves, your story view counts.
External analytics tools are useful for your own account when:
- You want to compare yourself to competitors using the same methodology. Meta’s Insights for your account vs Meta’s Insights for theirs is impossible (you don’t have access). External tools running the same calculation on both gives you a like-for-like comparison.
- You want longitudinal data Meta doesn’t provide. Meta’s Insights only goes back 90 days. Social Blade and similar have years of data.
- You want the metrics presented differently. Meta’s UI is functional but not always insight-oriented. External tools often surface patterns Meta buries.
For competitor analysis: external tools are your only option. Meta’s Insights is for your own data only.
The playbook in four numbers

If you remember four things from this page: 1 follower count is four different things — the real number is what matters. 2 engagement rate above 3% is strong. 3 best-time-to-post is calculable from public timestamps. 4 the gap between content mix and engagement mix is where the strategy lives.
Every public profile is a dataset. Run the math, find the patterns, learn from accounts ahead of you, partner only with accounts whose numbers are real. All free, all public, no login needed.
Related guides
- How to view Instagram profiles anonymously — the viewing companion to this analytics guide.
- The honest truth about private profile viewers — what analytics can and can’t do for private accounts.
- The anonymous Instagram viewer playbook 2026 — broader context on tooling the platform.
- Peekviewer features explained — how an analytics-equipped viewer stacks up.